Global Warming: Prelude to the Next Glacial Stage?
Ewing and Donn Revisited
Kenneth Piper, December 21, 2015
As a graduate student in 1976, I took a seminar class, Glaciology and Geomorphology, at UCLA from the late Professor Ron Shreve. Among the things we learned, some of the most memorable were things that, in hindsight, were obvious. For example, glaciers grow, not because it is getting colder, but because precipitation of winter snow exceeds the summer snowmelt. Conversely, if there is a lack of snowfall at the upper reaches of the glacier, it will recede. And, a glacier surges, not because of warming from the air, but because the ice at its base is melting. This can be because of the pressure of the overburden, or heat flow from the earth beneath it (or both). Although at least some climate models take this into account, we still see television programs that purport to show water on the surface of the Greenland ice sheet melting its way through the ice and coming out at the base. And we see photos of surging glaciers and Antarctic ice sheets that are said to be evidence of global warming.
Another thing we learned was that the current “ice age” (the entire Pleistocene, but also the Holocene, as we are still in the ice age that began about 2.6 million years ago) is dependent on the present configuration of the continents, with the Arctic Ocean mostly closed off from world ocean circulation. So, what can we make of all this, with respect to climate models?
Some researchers say that the Arctic Ocean must be frozen over during a glacial stage. But, you need a source of moist air, and the Arctic Ocean is a likely source. Only, it can’t be covered in ice. I think it’s time to revisit the ideas of Maurice Ewing and William Donn (although the original Science articles1,2 are not easily available outside of college libraries, a couple of articles were published in 19583,4, one by none other than Betty Friedan, before she was famous).
In 1956, Ewing and Donn came up with a theory that may be able to explain why open ocean in the Arctic must precede the major glacial stages. They had ocean core data that showed an abrupt warming of the North Atlantic, Gulf of Mexico, and Caribbean at 11,000 years ago, the end of the last glacial stage. According to their model, when sea level was high enough the Arctic Ocean got circulation of warmer water from the Atlantic Ocean. Because of this (not warming from above) the Arctic sea ice would melt. At the same time, the circulation would cool the Atlantic. (The significant open water of the Arctic that we are seeing in summer may be an indication that we are getting to that point, with or without man’s help.) The Arctic wind would be able to pick up enough moisture from the ocean to distribute it as abundant snowfall on the surrounding continents. The increased snowfall would grow glaciers. And the high albedo of the ice and snow would reflect solar radiation and cool the entire planet. Donn, a meteorologist, worked up global weather maps that showed storm patterns that would account for the observations. As the continental glaciers grew, the sea level would be reduced, until eventually circulation was cut off. Then, the Arctic Ocean would freeze over, and without the cold water input from the Arctic, the Atlantic Ocean would be warmer. The lack of an abundant source of moisture, and the warming of the northern Atlantic, would reduce the snowfall to less than the snowmelt. Glaciers would recede, sea level would rise, and eventually we would be back at the starting point, ready to enter the next glacial stage.
Their theory was discounted in the 1970’s because most researchers believed that there was no evidence that the Arctic Ocean had been ice-free during the Pleistocene (although Ewing and Donn did provide several lines of evidence to the contrary). Of course, they were hypothesizing at a time when researchers thought there were only four long glacial cycles over a million year time frame. Researchers now know there were many smaller glacial cycles within that million years. And, much of the cyclicity is likely tied to earth-sun orbital dynamics as first described by Milutin Milanković (figure 15, figure 26).
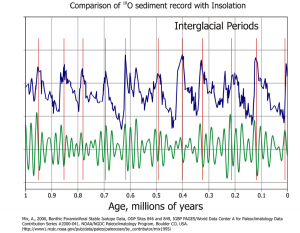
Figure 1. 18O isotope measurements from fossil foraminifera as a proxy for deep Pacific Ocean temperature (blue), compared to insolation (green).
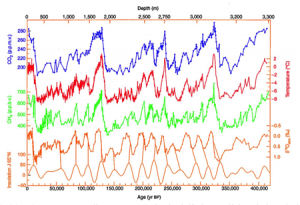
Figure 2. Antarctic ice core data showing the close correlation of insolation, temperature, and methane and carbon dioxide concentrations in the atmosphere.
Notice the relative regularity of the large (approximately 100,000 year) cycles in these figures. Because of this regularity, it is almost certain that variation of the Earth’s orbital eccentricity is involved. When at a minimum (as now), annual variation in solar input is about 6 percent; when at a maximum the annual variation is about 20-30 percent. And, the tilt of the Earth’s axis is affected by a larger approximately 40,000-year cycle, and a smaller 26,000-year axial precession. We are presently at a 23.5-degree tilt, decreasing from a maximum of about 24.5 toward a minimum of about 21.5 degrees. These combined, are most likely responsible for much of the intermediate-scale shifts. An interesting side note is that these charts show that without any human-induced climate effects, we would be in the same place. And, in fact, they show that we are already in the downturn shown in the larger cycles. The rapid upswing in temperature is during the disappearance of the continental ice sheets; the interglacial period is at the peak of the downward cycle (before glaciers start growing again). This fits with the Ewing and Donn model: General ocean temperatures would begin to decrease because of circulation with the Arctic Ocean. There would be a delay before sufficient Arctic sea ice melting precipitated renewed glaciation.
Researchers now know a lot more about ocean circulation as well (for example, figure 37), and it figures into some of the climate modeling. I would like to see climate models that show the ocean circulation extending into the Arctic Ocean, because, for thermodynamic reasons, I believe the warmer water below, not a warming of the air, is responsible for the summertime melting of the Arctic Ocean.
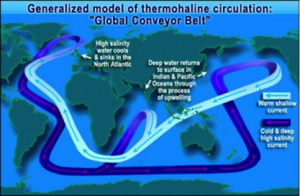
Figure 3. Generalized ocean circulation. Note that it does not show circulation into the Arctic Ocean.
Regardless of the cause of the changes, the Ewing and Donn model may provide a useful mechanism to explain the source of such an excess of snowfall. What it doesn’t explain is why the warming is so relatively rapid.
During the first Pleistocene glacial cycle methane would have been released (from methane hydrates) at the seafloor as sea level dropped. Methane so released could contribute to warming (as a far more potent greenhouse gas than carbon dioxide). However, once released, more hydrate is unlikely to have built up significantly during the colder climate. In fact, ice core data from Antarctica (figure 26) shows concentration of both methane and carbon dioxide correlate closely with temperature, probably because they are both released as seawater warms. Besides, again for thermodynamic reasons, the slight increase in air temperature cannot account for the rapid depletion of the ice sheets.
The rapid breakup of the continental ice sheets is more likely related to the thickness of ice. Ice sheets two miles thick would be expected to break up in a similar manner to ice sheets in Antarctica, as I described in the first paragraph above. Once a critical thickness had been obtained, they were likely continually in a state of surge; only a continual input of snowfall could have kept them at that thickness. And, it may not be a coincidence that the greatest calculated thickness of the ice sheets is upon very old continental crust that would have contributed less heat toward melting at the base.
Many climate researchers claim that the increase in carbon dioxide due to man-made burning of fossil fuels will over-ride the natural glacial cycles. However, a warmer climate, when combined with the solar and earth-orbit cycles, does not necessarily mean a drier climate. And, at 11,000 years out, we are about due for another temperature downturn.
I would like to hear what others think, and what additional information you have.
References Cited
- Maurice Ewing and William L. Donn, 1956, A Theory of Ice Ages, Science, v 123, p 1061-1066.
- Maurice Ewing and William L. Donn, 1958, A Theory of Ice Ages II: The theory that certain local terrestrial conditions caused Pleistocene glaciation is discussed further. Science, v125, p1159-1162.
- Betty Friedan, 1958, The Coming Ice Age: A true scientific detective story, Harpers Magazine, Sept. 1958, p 39-45, http://harpers.org/archive/1958/09/the-coming-ice-age/
- Leslie Lieber, 1958, Scientists Predict: Another Ice Age is on the way, Spokesman-Review, Spokane, WA, March 29, 1958, http://strongasanoxandnearlyassmart.blogspot.com/2011/07/scientists-predict-another-ice-age-is.html
- NOAA data from Richard Harwood, Class notes for Meteorology 106: Global Warming, http://facweb.bhc.edu/academics/science/harwoodr/GEOG101/Study/Images/O18_vs_Insolation_comparison_1million_yrs.gif. Original figure from A. Mix, 2000, Benthic Foraminiferal Stable Isotope Data, ODP Sites 846 and 849, IBP Pages/World Data Center A for Paleoclimatology Data, Contribution Series 2000-041, NOAA/NGDC Paleocliatology Program, Boulder CO, USA. http://www1.ncdc.noaa.gov/pub/data/paleo/paleocean/by_contributor/mix1995/
- Vostok (Antarctica) Russian ice core isotope data. Figure from Friends of Science website:http://www.friendsofscience.org/assets/documents/FOS%20Essay/Vostok_420ky_4curves_insolation.jpg
- National Aeronautic and Space Administration, 2015, NASA Science/Earth, Climate Variability,http://science.nasa.gov/earth-science/oceanography/ocean-earth-system/climate-variability/
Feature image is Ferrar Glacier, Antarctica, from wikipedia.org

